INTRODUCTION
Now that I've gotten my robot moving, it's time for it to figure out how to move on it's own. First, it has to learn hwo to build a map for itself and that's exactly what Lab 9 is all about. Using transformation matrices, careful implementation of our PID orientation control, and the Time of Flight Sensor, this task shouldn't be a problem.
GATHERING DATA
Unlike the name of the class, our robot actually should be moving slow to get accurate readings of its surroundings.
The TOF sensor might give faulty values otherwise. I also need to be extra sure that the robot is actually at the angles it
thinks it is because that will give the most accurate map possible. I chose to control the orientation of the robot using
PID designed in Lab 6.
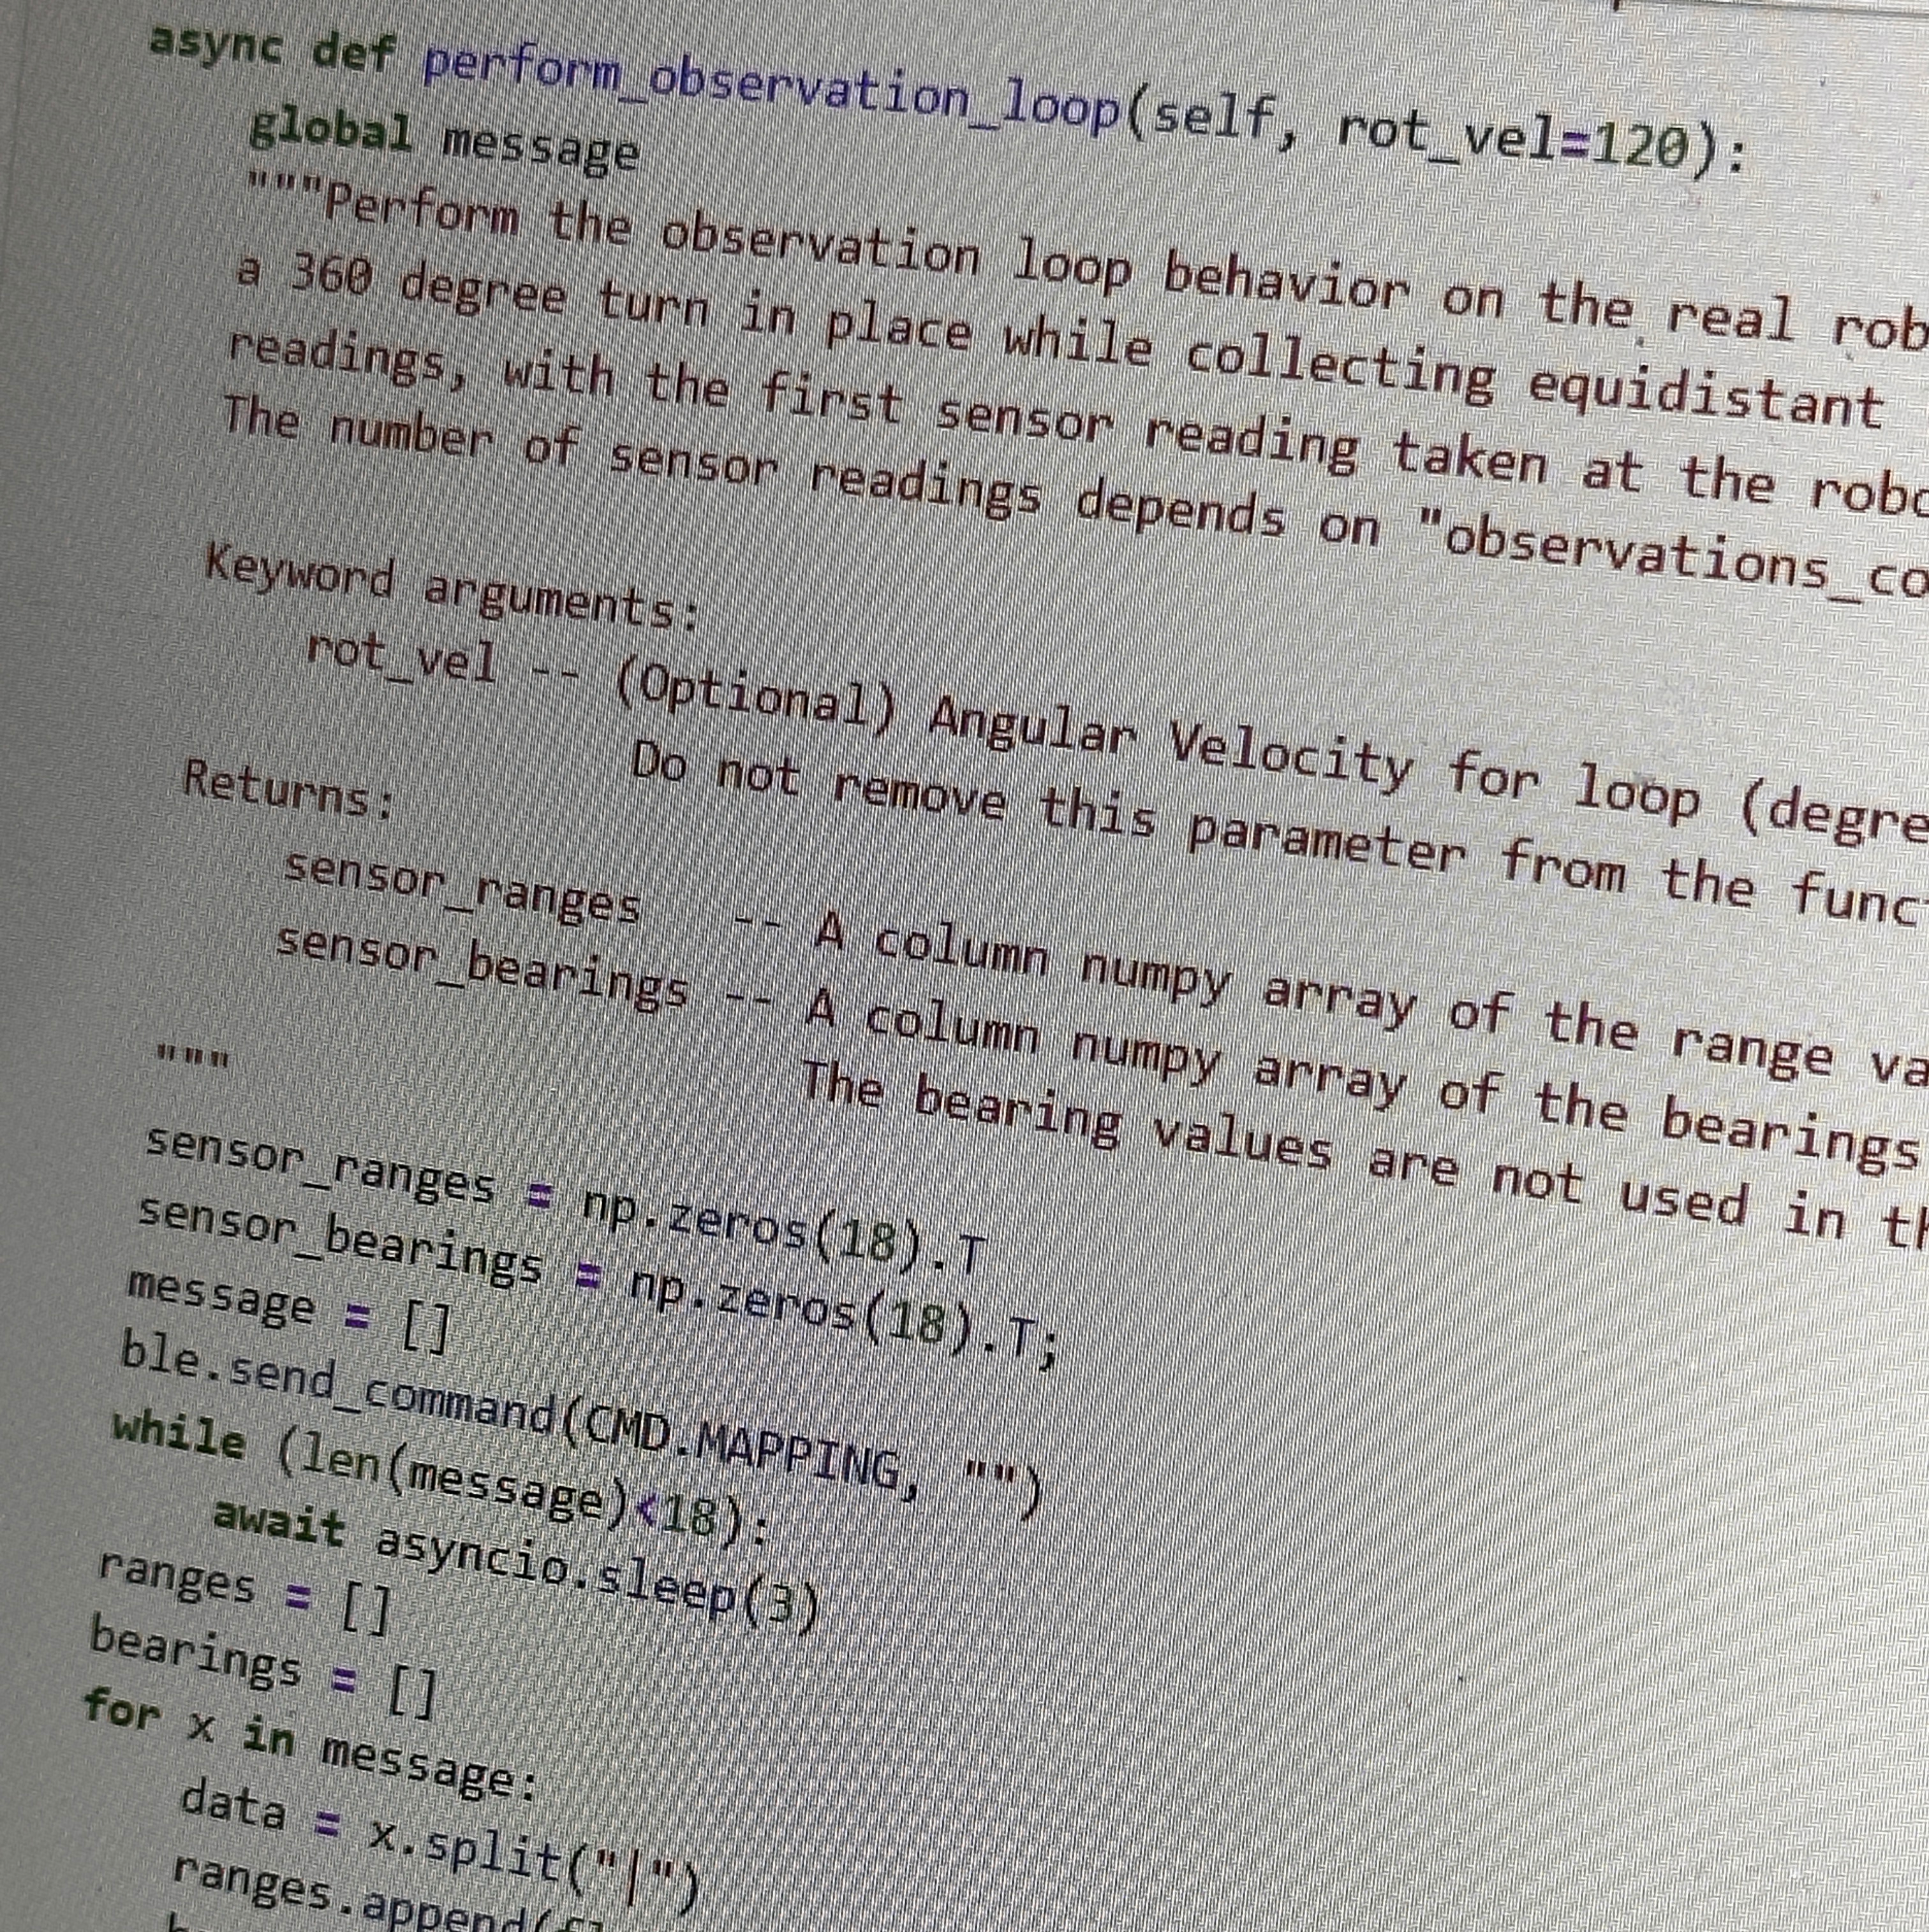
The script I ran to actually take the data simply incremented the reference value of the PID controller by 10 degrees until
it made a full circle. It would wait 500ms before taking five readings of the angle and both distances. This was to hopefully
cut down on any sensor uncertainty in my values. Below is the code I used to implement this and a video of it in action.
PRELIMINARY PLOTTING
Now that I had my function for gathering data, all I needed was to apply the transformation matrix:
For each rotation a different transformation matrix applied and my points that the matrix would be applied to looked like this:
This resulted in the following graphs and polar graphs for each point
Point (-3,-2)
Point (0,3)
Point (5,-3)
Point (5,3)
PUTTING IT ALL TOGETHER
Now I just needed to layer the graphs over each other, resulting in this:
This graph only looks as straight as it does because I corrected the angle of each sensor reading. Some initial error in allignment caused each set of data to be some constant angle off. The following numbers are the angle corrections for each point:
- (-3,-2) = 9 degrees
- (0,3) = 15 degrees
- (5,-3) = -15 degrees
- (5,3) = -17 degrees
Below is the code used for plotting each individual data set.
CONCLUSION
Transformation matrices are a powerful tool to convert large swaths of data into something useful. I've never plotted out an area using this method before and I feel I learned a great deal about building maps out of sensor data.


